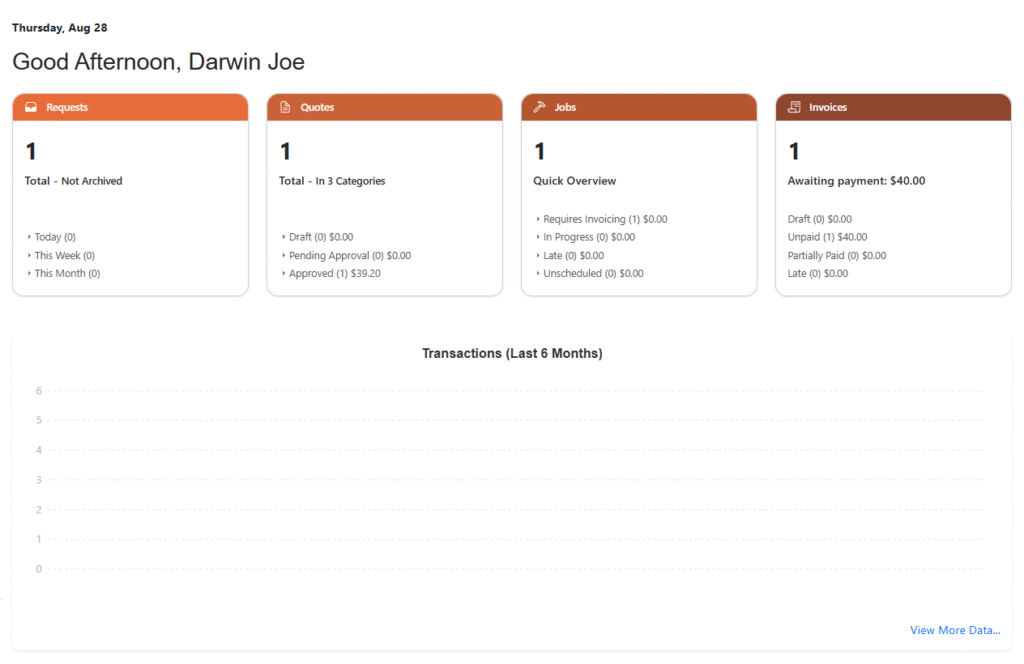
KPI (Key Performance Indicator) Dashboard
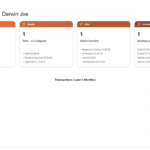
The Leavoda Dashboard is your command center, giving you a complete snapshot of your business at a glance. At the top, you’ll see key widgets like Requests, Quotes, Jobs, and Invoices, which shows totals, payemt statuses, and approvals so you can instantly track progress.
System Reminders and Today’s Visit Section
The dashboard also includes transactions history for financial tracking and a Today’s Visit section to show scheduled work. While System Reminders highlight important tasks like branding setup, payments, and tax configurations that need attention. Each card is interactive clicking into any box (e.g., Requests or Quotes) takes you to detailed views for deeper management. Use this page daily to monitor performance, catch issues early, and keep your business on track without needing to dig into multiple menus.

Lead to Client Conversion Report
The Lead to Client Conversion Report helps you measure how effectively your business is turning leads into paying clients. The report includes both a visual ratio chart and a timeline graph, so you can track conversion performance over the last six months. By reviewing this data, you’ll quickly see if follow-ups, quotes, or workflows need improvement to close more deals. This section gives you the insights needed to fine-tune your sales process, reduce lost opportunities, and grow your client base with better decision-making.

Meet Greg – Your AI Assistant
Greg is your built-in AI assistant, here to help you every step of the way. When you click on Greg, a chat window opens where you can ask him anything about using Leavoda—whether it’s scheduling visits, managing clients, creating invoices, or understanding reports. Think of him as your personal guide, ready to explain features, provide quick tips, and walk you through tasks so you can get the most out of the platform without searching through manuals.

