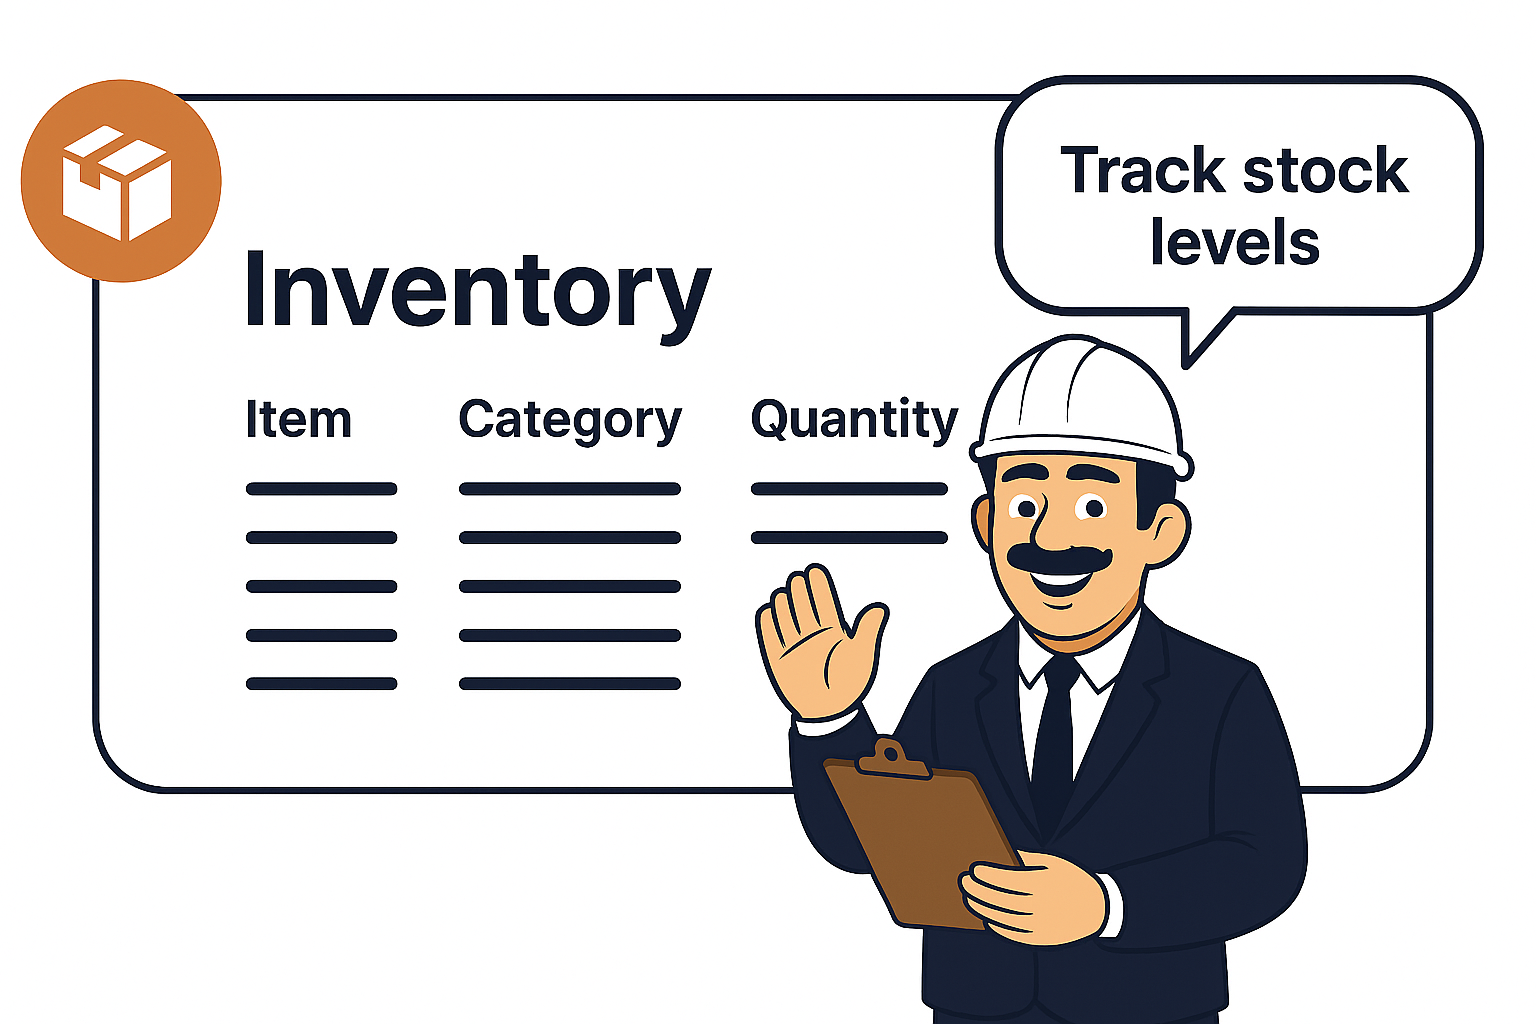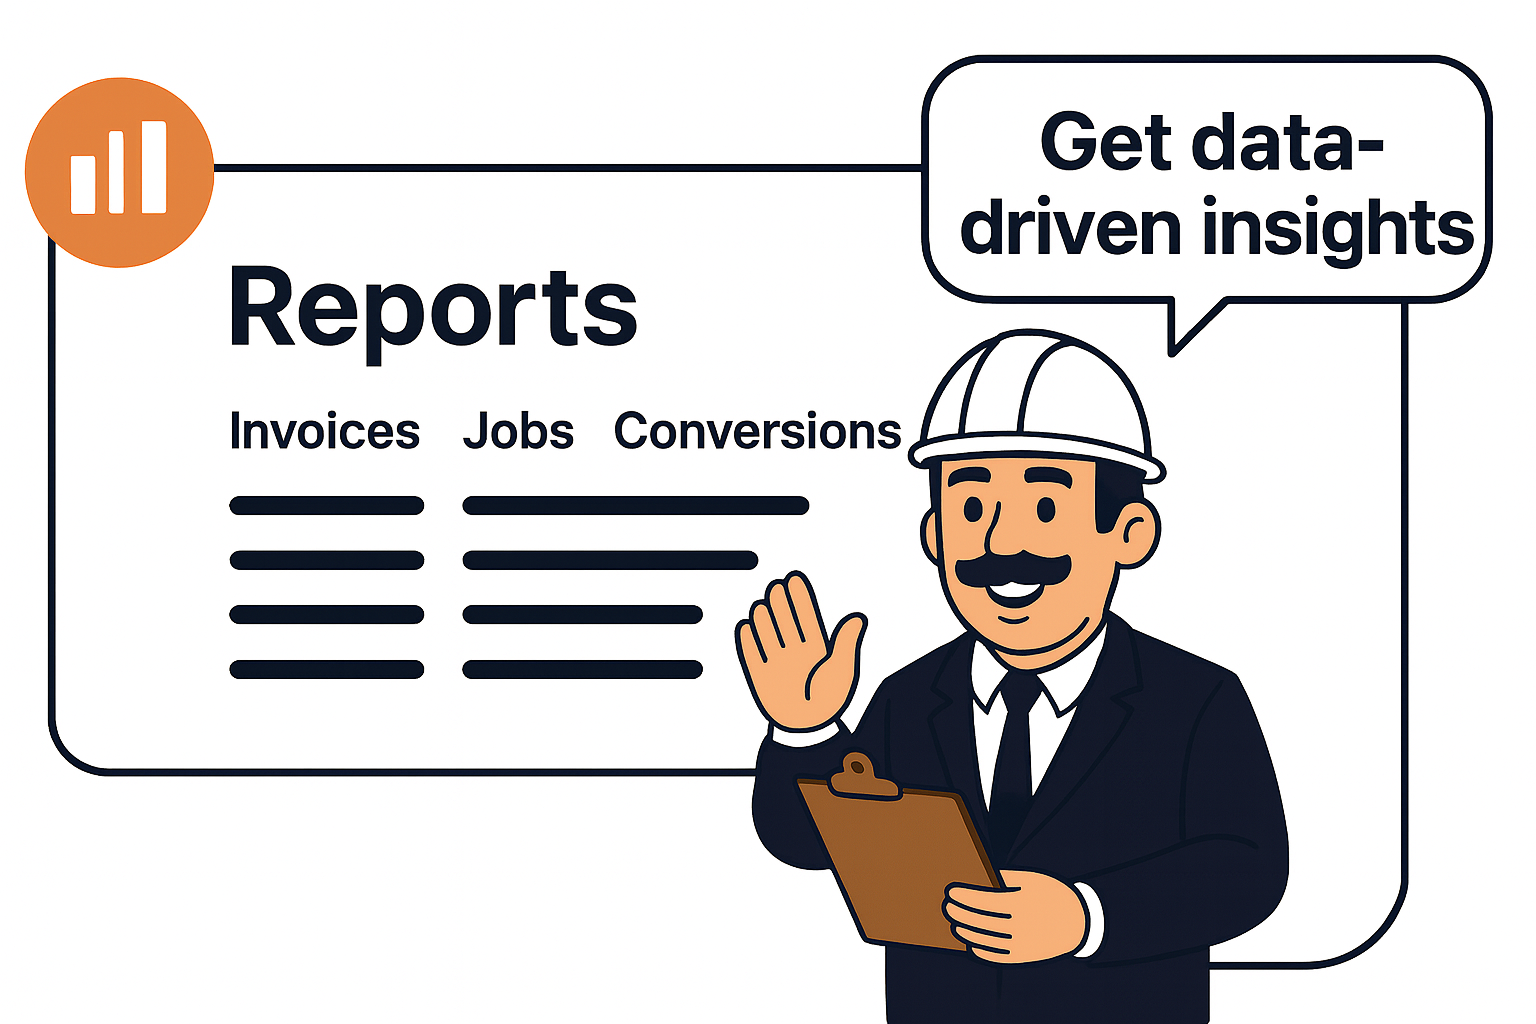
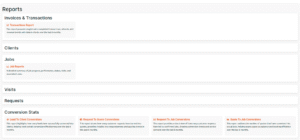
Reports Dashboard
This is the main Reports hub where you can access different types of insights:
-
Invoices & Transactions → Track revenue, refunds, and transaction trends.
-
Clients, Jobs, Visits, Requests → Get detailed summaries of performance and progress.
-
Conversion Stats → Monitor how leads, requests, and quotes are turning into jobs.
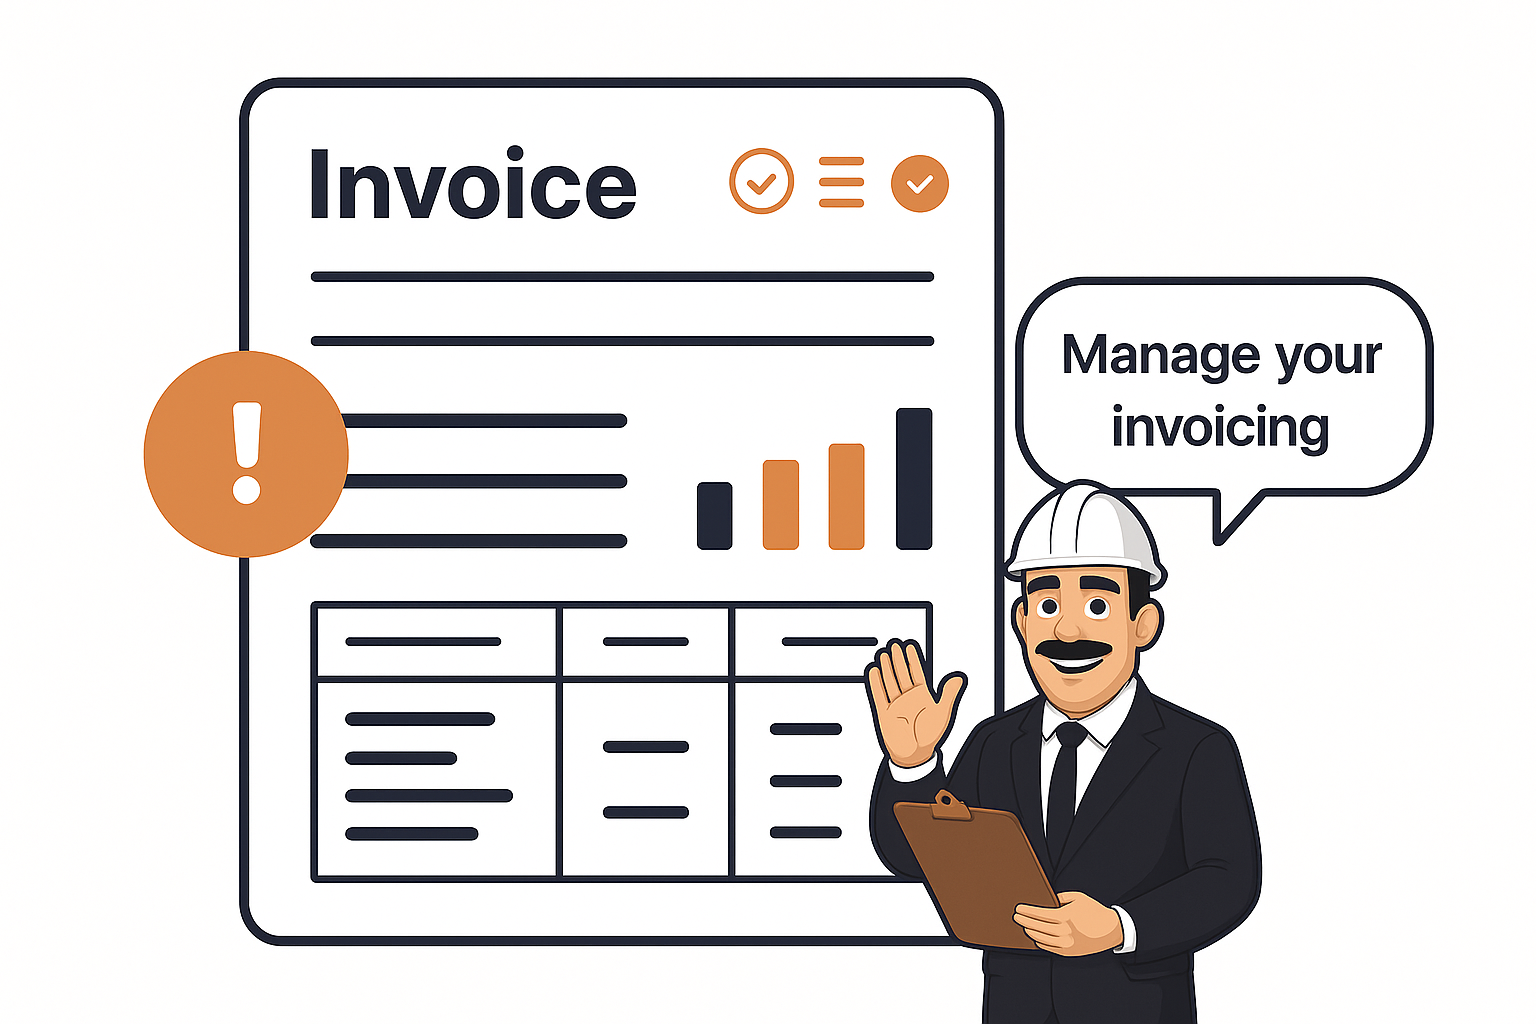
Transaction Report
Provides insights into financial performance:
-
Revenue trends: Displays total revenue across 6 months.
-
Completed vs refunded: Compares completed transactions against refunds.
-
Detailed table: Includes transaction IDs, amount paid, client contact info, and invoice numbers.
![]()
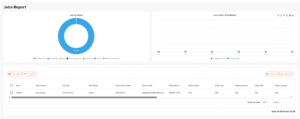
Jobs Report
Summarizes job activity and progress:
-
Jobs by status chart: Visualizes how many jobs are unscheduled, in progress, late, closed, or invoicing.
-
Job activity timeline: Tracks jobs created or completed across the last 6 months.
-
Detailed report: Lists job numbers, clients, job status, dates, and client details.
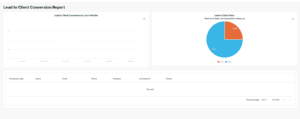
Leads to Client Conversions
Lead to Client Conversions Report:
-
It shows how many leads became clients over the last 6 months.
-
Purpose: To track your sales funnel effectiveness (how well you’re turning prospects into paying customers).
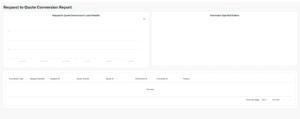
Request to Quote Conversion Report
Analyzes how many customer requests turned into quotes.
-
Graph: Shows responsiveness and quoting trends.
-
Table: Lists request IDs, quote numbers, and client/lead information.
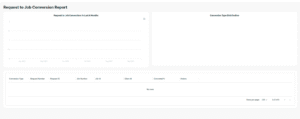
Request to Job Conversion Report
Tracks customer requests that turned directly into jobs.
-
Charts: Highlight request-to-job trends over 6 months.
-
Table: Provides breakdowns by request number, job ID, and client details.
Quote to Jobs Conversion
Shows how many quotes were successfully converted into jobs over the last 6 months.
-
Conversion graphs: View trends in conversions and distribution by type.
-
Table: Displays detailed records of quote numbers, related jobs, client IDs, and dates.